Market Insights
Property Values in Wollongong and the Illawarra — What the Escarpment Decides

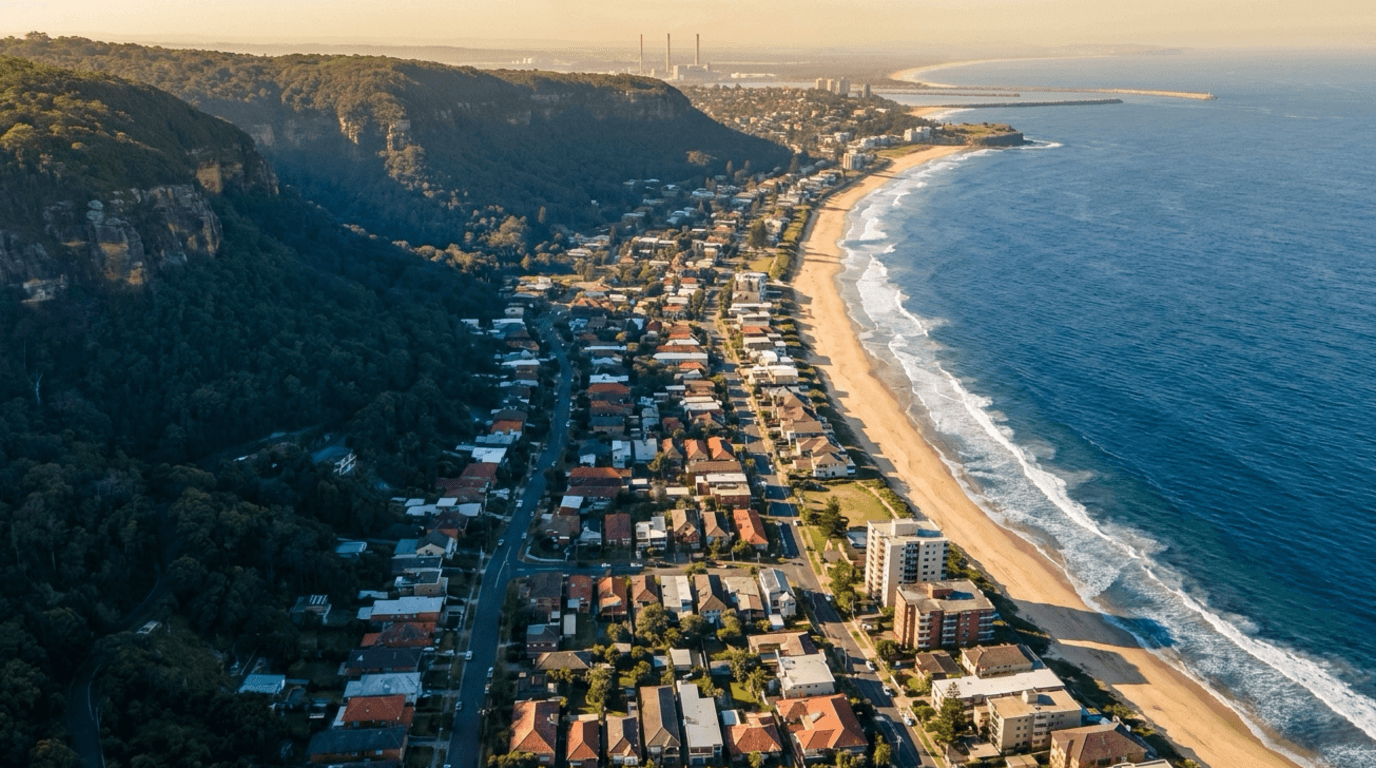
Look at the Illawarra from the air and the valuation problem is obvious: a city pressed into a strip a few kilometres wide between a sandstone escarpment and the Tasman Sea. Almost everything that makes property here valuable — the views, the beaches, the Sydney commute — and almost everything that constrains it comes from that geometry.
But the constraint that most often decides what you can actually build is not the escarpment you can see. It is a record in a council database that does not appear on any zoning map, is not visible from the street, and will not turn up in a portal estimate. This guide covers what really moves the number across Wollongong and the Illawarra: slope instability and how it is administered, why the coal beneath the escarpment produces the opposite regulatory picture to the Hunter’s, an operating steelworks that is routinely misdescribed, and why the region’s headline median hides the pattern that matters.
The slope instability regime, which is the thing to understand first
Development on unstable or potentially unstable land in Wollongong is governed by Chapter E12 of the Wollongong Development Control Plan 2009, Geotechnical Assessment of Slope Instability, in its version dated 19 July 2021. One caution on the citation before we go further: a 2024 planning certificate lists a draft chapter also numbered E12, for bush fire management, as being on public exhibition, while the adopted bushfire chapter is E16. A renumbering of the plan may therefore be in train. Cite the chapter by its name rather than its number if you are relying on it later, and confirm the number against the council’s current plan. Note that the controls sit in the DCP rather than the Local Environmental Plan. If you are working from advice that cites the LEP for slope instability, check the current WLEP 2009 before relying on it.
The trigger is a database entry, not a map. This is the part that catches people. Chapter E12 applies to development “upon lands known or suspected to be subject to slope instability, as recorded in Council’s property database or other relevant document or maps”. Council decides whether the policy applies by reference to information “contained in Council’s property database and other relevant documents or maps held in the office of Council”.
There is no public zoning layer you can check to rule this out. A buyer, a lender or an automated valuation model looking at zoning, contours and comparable sales will see nothing. The constraint is documentary, it is held by the council, and it attaches to the land regardless of what the site looks like on a clear day.
What the regime actually requires
Where it applies, the technical framework is the Australian Geomechanics Society’s Practice Note Guidelines for Landslide Risk Management 2007, read with the AGS guideline on landslide susceptibility, hazard and risk zoning. Chapter E12 defines the standard the assessment has to reach:
“Acceptable risk for loss of property is taken as low or very low in the risk matrix as published in AGS 2007 as amended. NOTE: This does not preclude development on sites where the risk has been identified as being moderate provided that measures are taken as described in the above-mentioned risk matrix …”
So a moderate risk assessment is not automatically fatal — it is a design and mitigation problem. What is fatal is set out separately: Council will not support development where there is “a history of landslide upon the subject site or related land” that has not been satisfactorily remediated, or where “the hazard risk cannot be reduced to an acceptable level either through appropriate building design or practicable mitigation measures”.
Three practical consequences follow, and each one bears directly on value.
The expert pool is narrow. The chapter requires chartered status with landslide risk management as a core competence and either five years’ practice in the last ten in parts of the Sydney Basin underlain by Narrabeen or Coal Measures strata or demonstrated relevant experience with similar geology, plus professional indemnity cover with retroactive effect. An engineering geologist meeting the same competency bar can also prepare or verify the assessment. The equivalence route means the pool is not as closed as the geology reference first suggests — but it is still a specialist appointment rather than a generalist one, with the lead time and cost that implies.
A geotechnical report has a shelf life of two years. Reports older than that “will not be accepted unless reviewed and certified” on the council’s form. And a report prepared for a subdivision does not automatically cover an individual lot within it without re-certification. A vendor producing the estate’s 2019 geotechnical report is not handing the buyer something ready to use — it needs review and certification first.
Remediation is not an event, it is a monitoring programme. Where a site has a landslide history, the chapter contemplates that remediation be “validated by the installation of in-ground instrumentation that must be monitored until the slope instability is confirmed as remediated”, and states plainly that “this process may extend over a period of many months or years”.
That last one is the sharpest point for anyone valuing a development site on the escarpment side. The cost of the engineering is knowable. The holding cost of an approval pathway that may run for years, with an outcome that depends on instrument readings, is a different kind of risk — and it is not something a per-square-metre land rate can absorb.
Chapter E12 makes the sequencing explicit, and the sequencing is the valuation problem. Where “development must be staged for geotechnical reasons and remediation of the site to an acceptable risk is necessary prior to any further development continuing on the site”, a declaration on the council’s form is required — and if it is not supplied, “the PCA must refuse to issue the construction certificate(s) until the completed form is submitted”. Remediation therefore has to be done, and certified, before the certificate for the rest of the build can issue.
So on a site that needs remediation, the works have to be funded and certified before the construction certificate for the dwelling can issue. That places a carrying cost and a completion risk between purchase price and end value — how large depends entirely on the site, and it is the kind of thing a per-square-metre land rate cannot express.
The hazard is mapped in detail — just not on a map you can search
This is the part that makes the Illawarra unusual. The landslide hazard here is not vaguely understood; it is one of the most thoroughly catalogued in the country. The University of Wollongong’s Landslide Research Team has maintained an Illawarra landslide inventory since 1993, field-mapped at 1:4000, developed in partnership with Wollongong City Council, the roads authority and the rail operator, and the university and council datasets have been merged into a single system that feeds the council’s day-to-day geotechnical management.
As presented in 2009, covering the period 1880 to 2006 across a 188 square kilometre model area, that inventory recorded 615 landslide locations and more than a thousand events, among them 501 slides, 52 falls and 49 flows, with volumes from under a cubic metre to 720,000, averaging around 21,800. Landslides had affected 2.37 per cent of the ground surface. The human and property toll over that period: five people killed, 51 houses damaged and 30 destroyed. The researchers’ own note that “costs are very poorly documented and understood” is worth repeating, because it is honest and because it is still true.
The susceptibility modelling that came out of it is the number to hold on to. The high susceptibility zone covers 13.4 per cent of the study area and holds 57.1 per cent of all known landslides. Moderate covers a further 9.2 per cent and holds 35.1 per cent. Put those together and under a quarter of the area accounts for more than nine in ten recorded landslides. The low and very low zones between them cover more than three-quarters of the area and account for under eight per cent.
The hazard is not diffuse. It is concentrated in a band, and the band is the escarpment.
Two things follow, and the second is the important one.
First, being in the Illawarra does not put a property at landslide risk. Most of the LGA is very low susceptibility, and treating the whole region as hazardous is as wrong as ignoring the hazard entirely.
Second — and this is the crux — that susceptibility zoning is a research product, not a statutory instrument. What binds a development application is the council’s property database record under Chapter E12, not the university’s model. So the position is genuinely odd: the hazard is mapped in unusual detail, and the mapping that decides your application is not the layer you can go and read.
Why the mapping is not published, in the regulator’s own words
The opacity is not an oversight, and we do not have to speculate about it. Wollongong City Council’s senior geotechnical engineer published an account of the regime in Australian Geomechanics in 2011, and it explains both where the maps came from and why they stay in-house.
The origin is litigation. Rapid post-war growth had pushed development onto marginal land, and then, in his words, “in 1974 and 1975 periods of prolonged as well as very intense rainfall resulted in extensive hillside instability. Many houses were lost and litigation followed. As consent authority and without clear guidelines on the development of hillside land Council fared poorly in court.”
The council took legal advice in 1976, and that advice is the foundation everything since rests on. In the regulator’s summary of it — we have not seen the opinion itself:
“a. Council is exposed to actionable negligence where it fails to consider whether the land to be developed has potential slope instability. b. Council is therefore required to have a policy or procedure which sets out what land is susceptible to slope instability and c. Council must refuse consent unless the application is supported by a consultant report which sets out the geotechnical conditions required for the development.”
Read that second limb again. The council is required to hold a record of which land is susceptible. That obligation is the reason the property database exists — and it is an obligation owed to the council’s own legal position as consent authority, not a service designed for purchasers. The distinction explains almost everything about how the information behaves.
There have been two generations of mapping. Bowman’s 1971 survey for the state geological survey produced the first landslide susceptibility maps for the city, with six zones running from “Stable Land – no landslip problems” through to “Essentially unstable land. Best left undeveloped. Some areas may be developed after detailed site evaluation”; those maps were public and, as at 2011, were “still frequently used by local geotechnical consultants to this day”. Amaral’s 1983 work derived a further set of maps from them, and here the paths diverge: those were “not for public release but to guide Council’s officers in their decision making”. The reason given in 2011 was:
“although the presentation of the maps has evolved with technology, the quality of the data supporting the base maps is still a remnant issue. As a consequence of this they are still not available to the public.”
In fairness to the council, the same paper records an intention to change that: it “plans to address the issue of its geotechnical maps not being publicly available in the future”, has sponsored the university landslide research described above with a public release in view, and had by then released preliminary mapping through its Escarpment Management Plan and Coastal Zone Study. We could not establish what has been published in the fifteen years since, and we did not find a publicly searchable landslide hazard layer for the area while researching this article — which is not the same as establishing that none exists.
The council’s working layer showed “the approximate location of known landslides” in red and land susceptible to instability, derived from the modified Bowman mapping, in yellow. As at 2011 the count of known landslides on it “has grown from 163 in 1991 to in excess of 600” — which is the point a purchaser should take from this. The record is not a fixed historical artefact. It accumulates.
One more thing from the same paper is worth knowing, because it explains a clause in Chapter E12 that otherwise looks like sloppy drafting. The 2006 predecessor required risk to be no worse than “acceptable”. But consultants were classifying “most hillside land (which is probably about one third of the urban area of the city) as being at ‘tolerable’ risk”. So: “Council was in a dilemma. Large parts of the city which had been developed for a very long period of time would not be approved under this DCP.” The impasse was resolved by adjusting the definition, so that a “‘tolerable’ risk pre-development could be deemed ‘acceptable’ post development subject to the implementation of the recommendations of the geotechnical consultant during development”.
Chapter E12’s own note — the one permitting development where a moderate risk can be reduced by design — reads as the descendant of that compromise, though it uses different terminology and arrived fifteen years later, so we put it no higher than that. Either way it is not a drafting nicety. In Wollongong the regulatory threshold had to be fitted to the physical reality of an already-built city, rather than the other way round, and about a third of the urban area is the land that made that necessary.
The administrative load has grown accordingly: geotechnical referrals to council engineers went from 12 referrals in 1990 to 400 by 2005/6.
The lot-specific answer exists — it is just not in the document attached to the contract
This is the part worth knowing before you buy, and it is a matter of which certificate you order.
A planning certificate issued under section 10.7 of the Environmental Planning and Assessment Act 1979 has two parts, and the planning department’s fact sheet on the 2021 regulation, published in August 2021, drew the line plainly. The section 10.7(2) part “must be attached to a contract for the sale of the land”. The matters supplied under section 10.7(5) “are not required to be attached to a contract for the sale of the land” — they have to be asked for. (Our sample was issued as a combined “Section 10.7(2) & (5)” certificate under a single reference, which is how a purchaser who asks for both receives them.)
Slope instability appears in both parts. The half that describes your land is in the optional one.
In the 10.7(2) part, item 10 asks whether the land is affected by an adopted policy restricting development because of the likelihood of “land slip, bush fire, tidal inundation, subsidence, acid sulfate soils, contamination…”. Wollongong answers by listing the policies it has adopted, among them: “Council has adopted ‘Wollongong Development Control Plan 2009 – Chapter E12 Geotechnical Assessment’.” What makes that answer uninformative is not that it is boilerplate but something sharper: it appeared on a certificate whose lot-specific land stability answer was negative. The E12 line is not conditioned on the land being on the instability layer. It confirms the policy exists. It says nothing about the land being sold.
In the 10.7(5) part, a heading titled LAND STABILITY answers for the individual lot, and does so by reference to a layer item 10 never mentions: “Council’s land constraint/stability assessment maps do not show that the land is located in an area where landslip and/or subsidence have occurred, or where land instability is suspected.”
So the council does hold a lot-level instability layer, and it will tell a purchaser what that layer says. Three qualifications travel with the answer, and all three are printed on the certificate:
- The council “does not warrant that its land constraint maps contain all information ever received by Council relating to the stability of the land”.
- On a 10.7(5) request the council is “under no obligation to furnish” the information at all.
- Section 10.7(6) of the Act means a council “shall not incur any liability in respect of any advice provided in good faith” under subsection (5) — and, in the certificate’s own words, “the absence of any reference to any matter affecting the land shall not imply that the land is not affected by any matter referred to in this certificate”.
That is the shape of the problem in one paragraph. The document that must accompany the contract of sale carries a statement true of the entire city. The document that speaks to the actual lot is optional, separately paid for, supplied under no obligation, without any warranty of completeness, and behind a statutory immunity. A purchaser who orders only what the contract requires has been told nothing about their land — and nothing in what they received will tell them that.
The practical instruction follows from it: in the Illawarra, order the 10.7(5) as well, and read the LAND STABILITY heading. It is the cheapest step in the whole transaction and it is the only one that asks the question about your property rather than about Wollongong.
What a lender’s valuer does with it
The disclosure gap has a downstream consequence, because the next person to look at the property is usually a valuer acting for a bank, working to a standardised instruction set — the banking industry’s Residential Valuation Standing Instructions for PropertyPRO reports. Landslip is named in it. Under the heading for identifying adverse risks, the enumerated items include “Landslip or mines subsidence”, alongside flooding, environmental hazards and onerous easements.
What matters is the distinction the instructions draw between two kinds of adverse risk, because in the Illawarra it is the whole ball game:
“A general adverse risk is considered to be an effect that is common to the area / location and does not have an adverse impact on marketability and value specific to the subject property.”
“Conversely, a critical adverse risk is specific to the subject property and considered to have a negative impact on marketability and value. Appropriate comments and consistent Risk Ratings and VRAs should be triggered.”
A hazard shared by a whole hillside is general, and it does not penalise the property. The same hazard, once it attaches to the particular lot, is critical, and it sets off the machinery. A separate table in the same instructions applies the same two labels to a different question — which documents a valuer should call for — and it is there that the line for this hazard is drawn. The row for a geotechnical engineer’s report reads:
- General effect — “The property is located in a designated land slip area; however, the property shows no sign of any slippage or ground movement.”
- Critical effect — “The property is located in a known land slip area and shows signs of slippage.” (One edition of the instructions adds “and subsidence” here; see Methodology.)
So being in a designated slip area, on land showing nothing, is treated as an area characteristic. Visible signs of movement on the land itself move it into critical, where the instructions say comments and a Valuation Risk Alert “should be triggered” — landslip is listed among the environmental issues under the alert for a property “adversely impacted by an environmental issue” considered to “significantly reduce its appeal to the market” — and a geotechnical engineer’s report may be required.
Note where that leaves the line: it is drawn by what is observable on the lot, at a time when the definitive record is held in a database the valuer cannot search either. Two neighbouring properties can present identically on inspection and sit on opposite sides of the council’s layer.
What the risk rating actually is, and what it is not
The rating scale itself is set out in the Australian Property Institute’s PropertyPRO Supporting Memorandum, effective 10 May 2020, which runs from “‘1’ – Low risk – no readily identifiable adverse issue” to “‘5’ – High risk – there is an extremely important/urgent adverse issue in the Report …”. A 4 is defined as “Medium to High risk – there is an important adverse issue in the Report for the Client to consider before relying upon the Report”, and any rating of 3 or above “must be commented upon” in the report.
Its property risk ratings matrix, under the heading for environmental issues, places the two coal-country hazards at different points on that scale:
- Rating 3 — “Overlays/Zones such as bushfire, flood, cyclone, mine subsidence district etc.”
- Rating 4 — “Geotechnical issues such as landslip.”
- Rating 5 — “Property adversely affected by mining subsidence.”
Being inside a declared mine subsidence district is a 3: an issue for the client to note. A geotechnical issue such as landslip is a 4: something to consider before relying on the report. Mine subsidence reaches 5 only once the property is adversely affected by it — so at the top of the scale the ordering reverses, and only subsidence gets there. And note what is being compared. The rating 3 entry is a designation — being inside a mapped overlay — while the rating 4 entry is an identified problem. There is no “landslip overlay” entry at 3, so this is not evidence that a designated slip area alone scores a 4; the previous section is explicit that a designation on land showing nothing is the general case. What the matrix does show is that once a slope issue is identified, it sat a step above a Hunter subsidence overlay on the edition we read — worth knowing in a region where the overlay is the more famous of the two hazards. Check the current edition before relying on the placement — the standing instructions themselves require the most recent Supporting Memorandum, and the one we read carries a 2020 date of effect.
One correction is worth making explicitly, because the opposite is widely repeated. A high rating is not, by itself, a lending recommendation, and the Memorandum is explicit: “A high risk rating is not necessarily intended as a ‘don’t lend’ advice. The Valuer’s role is to flag known or perceived potential risk issues”, and “Risk Ratings are an indicator only and should not be relied upon alone in lending considerations”. Nor does a rating move the number: risk ratings and market value are “mutually exclusive and must be assessed independently of each other”, and “it is not appropriate to adjust the market value to achieve a desired risk rating or vice versa”. The rating is a flag raised for the lender. What the lender does with it is the lender’s decision, and we make no claim about it.
There is a last point here, and it is ours rather than either document’s. The Memorandum draws a boundary around the risk analysis: it rests on information that is “common knowledge and/or readily ascertainable”, expressly “does not reflect information that is privileged, or to which the market for that class of property in its market place does not have ready access”, and is in any case “a simplified analysis … not a technical analysis”. Set that beside the council’s 2011 account of its own geotechnical maps: they were “still not available to the public”.
Be precise about what that does and does not mean, because it is easy to overstate. What sits outside the valuer’s reach is the mapping layer, not the answer. The answer is obtainable by anyone who asks for it, through the 10.7(5) certificate described above — and the council’s engineer records that obtaining the list of constraints before lodging an application is “usual practice”. So this is not a wall. It is a step, and the step falls on whoever thinks to take it.
That is the honest version of the gap, and it is still worth stating. A mortgage valuation is a simplified analysis of what the market can readily ascertain, delivered on a lender’s timetable. The definitive record is one request away, but it is a request someone has to make, and nothing in the contract of sale prompts it. Each system is working exactly as written. The cost of the step nobody took lands on the buyer.
The mine subsidence row in the lender’s schedule closes a loop with our Newcastle and Hunter guide. There, being in a designated mine subsidence area is the general effect; the critical effect is being in one “and the Valuer suspects the improvements have not received appropriate Council approvals”. Which is the same test Subsidence Advisory applies to compensation. In both the lending and the compensation systems, the thing that actually costs an owner money is not the subsidence — it is the unapproved extension.
Why the escarpment behaves differently from a floodplain
The 17 August 1998 storm is the reference event for how fast this terrain moves. Twenty-four hour totals to 9am on 18 August reached 445 mm at Mount Ousley, 410 mm at Bulli Pass, 337 mm at Keiraville, 316 mm at Wollongong and 313 mm at Figtree, with hourly intensities above 120 mm at several gauges and up to 249 mm falling in three and a half hours. The main burst came between 5pm and 8pm on the 17th. There was flash flooding, extensive property damage, one death, and debris flows across Bulli Pass in the early hours of the 18th. Small escarpment catchments inside the peak intensity zone showed rainfall-to-runoff ratios approaching 100 per cent.
That last figure is the mechanism. On a steep, short catchment with thin soils, the ground saturates in tens of minutes and then effectively everything that falls runs off. The escarpment converts a downpour into torrent with almost no attenuation. This is not floodplain behaviour and it does not show up in floodplain mapping — a lot at the foot of the escarpment can sit outside any mapped flood extent and still be exposed to debris flow.
The region’s worst landslide event predates that storm by a decade. At 3.23am on 30 April 1988, the railway embankment at Coledale failed and swept away a house, killing two people. The State Rail Authority pointed to long-term instability of an embankment built in the 1880s, the way it had been widened in the 1980s, and a blocked culvert on the night. That account has been contested since — at least one engineer has argued the failure was a rainfall-triggered landslide rather than a culvert failure — so the cause is best described as disputed rather than settled. What is not disputed is the outcome, or that the embankment had been known to be unstable for a century.
Coledale is also where the geotechnical regime was first tested, and the result is instructive. The council was named among the parties investigated by the Coroner. On the early findings of the inquest, as the council’s own later account records, it was “cleared of any role in the landslide since all developments above it had been subject to the geotechnical review process and had supporting geotechnical advice submitted prior to the granting of consent” — we have not sighted the coronial findings themselves, and the account is the regulator’s own, written more than twenty years afterwards. Note that in 1988 the applicable regime was the review process descended from the 1976 legal advice, not Chapter E12, which dates from 2009. The paperwork the review process compels is, in a real sense, the thing the whole system is built to produce.
The regime has an off-ramp, and it matters
One provision does a lot of work to bound all of this, and it is easy to miss. Where Council is satisfied — having considered the site, related land, any relevant geotechnical report and any other information available to it — that the site and related land carry an acceptable risk of slope instability, the application may be processed without a geotechnical report at all.
So a database flag is not an automatic report. It is a question Council answers, and it can be answered in the applicant’s favour on the papers. The chapter also describes itself as applying to “the majority of” development proposals on affected land rather than all of them, and provides a certified route for minor construction and demolition work that lets small, inconsequential development proceed without a report.
Two conclusions for a valuation. The constraint is real and it is invisible, which is the point of this section. But it is not a blanket prohibition, and treating every flagged site as though it carries the full assessment burden overstates the position as badly as ignoring the flag understates it.
What does not trigger it
The chapter exempts a defined set of works, which is worth knowing because it prevents over-reading the constraint: exempt and complying development, forming openings in a wall or roof, non-structural work, an articulated verandah or deck, and “minor earthworks, including landscaping involving excavations or fill not in excess of 600mm in vertical height”. A modest landscaping job on a sloping block is not, by itself, a geotechnical matter.
The second instrument: what you can actually build on the escarpment
Slope instability decides whether you can build safely. A separate chapter decides how much you can build at all, and it works in a way I have not seen replicated anywhere else in New South Wales.
Chapter B6 of the Wollongong DCP, Development in the Illawarra Escarpment, in force since 1 July 2023, applies “to all lands within the Illawarra Escarpment generally at or above the RL 50 metre contour level extending upwards to the top of the escarpment with a 150 metre buffer (ie as shown in Figure 1)”. A map in the chapter shows those boundaries.
Two filters then apply together, and both matter. The land must be within that mapped escarpment area, and it must carry one of eight zones under the Wollongong LEP 2009: RU1, RU2 or RU4 primary production and rural landscape, the C1 to C4 environmental zones, or SP2 infrastructure. None of those is a standard residential zone, so B6 does not reach ordinary R2 suburban stock even where it sits high on the slope.
That makes B6 a narrower instrument than the slope instability regime — but a far more prescriptive one where it bites, because it governs precisely the rural and environmental land on the escarpment that carries the region’s development-site value.
Your building envelope is a fraction of the height of the trees
This is the control that decides value on the escarpment, and it is worth quoting exactly. Chapter B6 states that “development will only be permitted where it is contained within a Development Opportunity Envelope”, and then defines that envelope’s vertical limit:
“The vertical limit of the Development Opportunity Envelope shall be defined as no greater than 66% of the height of the forest trees providing foreground screening adjacent to the Development Opportunity Envelope.”
Read that again. On escarpment land, buildable volume is not set by a floor space ratio or a height in metres. It is set at two-thirds of the height of the trees that screen the site from designated public viewing locations. The chapter’s stated objectives make the logic explicit: development is to be contained within the visual envelope the vegetation already provides.
The consequence for value is direct and counterintuitive. The vegetation is not landscaping — it is the basis of the development right. Clearing the screening trees does not open the site up; it shrinks the envelope. A purchaser who buys an escarpment block intending to “clear the view” can reduce what they are permitted to build by doing so.
The envelope itself is derived from the size of the cleared portion of the site, the slope, the height and composition of surrounding vegetation, the length of clearing along the slope, and the angle at which sightlines pass over foreground vegetation. And the assessment “will require input of the sightlines from key viewing locations by a Registered Surveyor”.
So an escarpment development application needs two specialist inputs before anyone draws a house: a geotechnical assessment from that narrow pool of qualified engineers, and a registered surveyor’s sightline analysis from designated public viewpoints. Chapter B6 closes the loop back to the geotechnical regime itself, stating that “a geotechnical report will be required for the majority of development upon lands within the Illawarra Escarpment”, except where prior investigation has conclusively shown no slope instability impact.
Single storey is the default, not the floor
Chapter B6 provides that dwelling houses “should generally be restricted to a single storey height and broken up into a series of pavilion forms, which step down the slope of the site”. Two-storey dwellings “will only be permitted in circumstances where the building envelope is either screened by foreground remnant vegetation or is within a valley floor / lower escarpment slopes and the proposed building will have no or little visibility from key viewing locations.”
A second storey on the escarpment is therefore an exception conditional on invisibility, not an entitlement. For a site being valued on development potential, that is the difference between two plausible schemes and one.
One more clause repays attention. Among the chapter’s objectives is ensuring development is “restricted to legally cleared sites” within the escarpment slopes and foothills. The qualifier does the work: historic clearing that was never authorised does not create a development opportunity. A site that looks open may not be treatable as open.
The ten precincts
Chapter B6 divides the escarpment into ten precincts, each with its own designated key viewing locations: Marshall Mount/Calderwood, West Dapto Bowl, The Heights, Mount Kembla, Mount Keira, Balgownie Valley, Coastal Ridges, Cliff Coast, Stanwell and Maddens Plains.
That is an official sub-market grid, and a more useful one than any postcode split. Cliff Coast — Austinmer, Coledale, Wombarra, Scarborough, Clifton — is simultaneously the region’s premium northern coastal strip and the ground where its worst landslide occurred. Precinct, hazard and price sit on top of one another.
The chapter traces its lineage to the Commission of Inquiry into the Long Term Planning and Management of the Illawarra Escarpment of May 1999, and the strategic management and land use review work that followed. This is a settled, deliberate regime, not an incidental overlay.
Note finally that B6 does not set its own lot size, floor space ratio or height numbers — it defers to the corresponding maps in the Wollongong LEP 2009. For a specific address you therefore need the LEP maps as well as both DCP chapters. That is three documents before you have a development envelope, and none of them is visible from the footpath.
The coal question, and why the answer is the opposite of the Hunter’s
There is coal under the Illawarra, and there is longwall mining still operating in the southern coalfield. It is natural to assume the Wollongong property market carries the same mine subsidence overlay that shapes Newcastle and Lake Macquarie. It does not, and the difference is structural.
There are no declared Mine Subsidence Districts in the Wollongong local government area. Subsidence Advisory NSW publishes the complete list of declared districts in the state, and the ones relevant to the southern coalfield — Appin, Wilton, Picton, South Campbelltown and Bargo — sit on the plateau to the west and north of the escarpment, in the Campbelltown, Camden and Wollondilly council areas. The Appin district plan, for instance, names only Campbelltown City Council and Wollondilly Shire Council. The inhabited Illawarra coastal strip is not inside a declared district.
So the escarpment does something quite precise: it separates two regulatory regimes. On the plateau above it, the mine subsidence framework applies, with its own approval pathway and a set of ten surface development guidelines assigned property by property. On the coastal strip below it, where nearly all the Illawarra’s housing sits, the binding documentary constraint is the slope instability regime described above, not Subsidence Advisory.
This matters practically because the opposite claim circulates. Content asserting that significant parts of the Wollongong LGA fall within mapped mine subsidence districts, and that Subsidence Advisory approval is required, does not match the agency’s own published districts and maps. Check the district list rather than a secondary summary.
Deep longwall does not subside houses — it fractures cliffs
The clearest illustration of what the Illawarra’s coal risk actually is comes from a refused development application. In February 2021 the Independent Planning Commission refused the Dendrobium Mine Extension Project, which sought to mine 78 million tonnes of additional coal from new areas near the Avon and Cordeaux dams and extend the mine’s life to 2048.
The impacts the Commission weighed were not suburban. They were a predicted loss of up to 5.2 million litres of water a day from Lake Cordeaux and Lake Avon, surface-to-seam cracking, degradation of 25 watercourses and wetlands within Sydney’s Metropolitan Special Area drinking water catchment, and potential instability and fracturing of up to 40 cliffs above the proposed longwalls. The Commission found the risks high, the impacts not appropriately manageable and likely to be irreversible, and the project not in the public interest. A separate application to extend the mine’s life to 2041 was subsequently withdrawn.
That is the Illawarra’s coal risk in one paragraph, and it is a different animal from the Hunter’s. Shallow historical workings under Newcastle suburbs threaten the houses above them. Deep longwall under the Illawarra escarpment threatens cliffs, watercourses and reservoirs — which is why the regulatory apparatus here is environmental and catchment-focused rather than a residential subsidence district scheme.
The mines themselves reinforce the geography. Dendrobium works the Wongawilli seam immediately adjacent to Mount Kembla, about eight kilometres west of Wollongong on the escarpment, and is an essential metallurgical coal supplier to the Port Kembla steelworks. Appin, the other major southern coalfield operation, sits roughly 25 kilometres to the north-west in the Macarthur region — outside the Wollongong LGA, on the plateau, precisely where the declared subsidence districts are. Illawarra Metallurgical Coal changed hands in 2024, when South32 completed its sale to a joint venture of Golden Energy and Resources and M Resources trading as GM3.
A note on currency for anyone reading further: Dendrobium holds development consent to 2030, and a further proposal to extend operations into the 2040s within the existing lease has been in preparation. We are not going to predict its outcome, and any article that tells you the extension is settled one way or the other should be checked against the planning portal.
Two nuances that survive the district boundary, both of which bear on value.
The first is that compensation does not stop at the boundary. Subsidence Advisory’s position is that all homes and buildings in NSW, “whether inside or outside a declared district”, are eligible for compensation for mine subsidence damage — provided the correct development approvals were obtained. Outside a district you do not need prior approval from the agency, but the entitlement is conditional on the building work having been properly approved. An unapproved extension, carport or retaining wall can therefore compromise a compensation claim years later, and nothing about it is visible from the street. It is the same class of documentary risk as the slope instability record.
The second is that the location of historical mine workings is not straightforwardly public. Subsidence Advisory’s mapping layer is built from geospatial data held by the NSW Resources Regulator, and mine survey plans are generally not available to the public under the relevant work health and safety regulation. The agency applies a buffer around historical workings because their recorded position can differ from reality after a century of mining, and states plainly that its layer “must not be used for the basis of any risk assessment purpose” and that workings “must be independently verified”. A valuation that needs to reach that question cannot resolve it from a public map.
Port Kembla: an operating steelworks, not a brownfield
A correction worth making plainly, because it is repeated constantly and it materially misprices industrial land in the region. The Port Kembla Steelworks is operating. It is owned by BlueScope, which took the steel business on when it was demerged from BHP in the early 2000s. It is Australia’s largest crude steel production plant. It employs roughly 3,000 people directly in the Illawarra and underpins in the order of 10,000 jobs across the region. BlueScope has approved a reline of its No. 6 blast furnace — a reinvestment of $1.15 billion in continued operation.
The phrase “the former BHP steelworks” is accurate in Newcastle, where the Mayfield plant closed in 1999 and was remediated. Applied to Port Kembla it is wrong on both counts, and it leads people to treat an operating industrial precinct as a transition site.
BlueScope’s board has approved the No. 6 blast furnace reline at a cost of $1.15 billion, revised up from earlier estimates. It is described as the largest investment in the steelworks’ history, is expected to secure Illawarra steelmaking for up to two decades, and was due for completion during 2026. We are writing inside that window and have not confirmed that the furnace has been relit, so treat completion as scheduled rather than done.
Two energy projects that are less settled than they sound
Two Port Kembla developments come up constantly in conversations about the region’s future. Both are more provisional than the coverage suggests, and for a valuation that matters.
The offshore wind zone is declared, and currently has no proponent. The Illawarra area was declared on 15 June 2024, covering up to 1,022 square kilometres at least 20 kilometres offshore between Wombarra and Kiama, with a stated potential of 2.9 gigawatts. The consultation that preceded it drew 14,211 submissions, and the declared area was pushed a further 10 kilometres out to sea from what was originally proposed, expressly “to minimise visual impacts”.
Then nothing happened. The feasibility licence window opened in June 2024 and closed that August without a licence being awarded, and on 23 January 2026 BlueFloat Energy withdrew its application — the only remaining interested developer — as part of exiting the sector globally. As things stand the zone remains declared with no active applicant.
So the accurate position is neither “turbines are coming” nor “the project is dead”. It is a dormant regulatory designation that could reopen if a developer emerges. We are not going to assert an effect on coastal property values either way: we could find no sourced Australian study on the price impact of a declared offshore wind zone, and with no proponent the question is speculative. For anyone assessing visual amenity, the department’s published distances are the concrete fact — roughly 20 to 22 kilometres from Stanwell Park, Thirroul, Bulli and Wollongong, 25 from Kiama Lighthouse, 30 from Werri Beach.
The gas import terminal is built but not importing. Squadron Energy’s Port Kembla Energy Terminal — Australia’s first LNG import facility, with capacity of up to 500 terajoules a day, close to the whole of New South Wales peak daily demand — has completed construction, but start-up has slipped repeatedly and is now expected no earlier than 2027. That timetable has moved more than once, so date any reliance on it.
The genuine valuation work in the Illawarra’s industrial land is therefore distinguishing what is operating from what is actually transitioning, and distinguishing both from what has been announced. Both exist here, sometimes adjacent. Contamination status, remediation liability, zoning transitions under the Wollongong LEP and development potential all matter — but they matter to specific parcels, not to a blanket regional narrative about post-industrial decline.
The market, and the one number that undoes the usual story
The Illawarra median dwelling value sat at $1,082,674 in June 2026, on Cotality data. It has been above a million since March 2025.
Put that next to Sydney’s median of $1,265,608 in the same month and the gap is about $183,000 — roughly 14 per cent below Sydney, or about 17 per cent measured against the Illawarra figure. That is a narrower spread than the “affordable Sydney alternative” framing implies. The Illawarra is not a cheap fallback market. It is a million-dollar market that happens to be an hour and a half from Sydney.
It is also, at the moment, holding up better than the city it is supposed to be an alternative to. Across June 2026 the national index fell 0.4 per cent — its largest monthly fall since December 2022 — and Sydney fell 1.2 per cent, having dropped 3.2 per cent across the quarter. The Illawarra fell 0.2 per cent. Regional New South Wales was flat over the month and up 0.2 per cent across the quarter, sitting a fraction below a peak reached in April 2026.
Where the correction is actually landing
The regional average conceals the more useful pattern. Across June 2026, the sharpest monthly fall in the region was Thirroul to Coalcliff, down 1.0 per cent. Windang to Primbee fell 0.7 per cent. The only areas to rise were Helensburgh, Albion Park Rail and West Wollongong, each up 0.3 per cent.
Look at that first line against everything above. Thirroul to Coalcliff is a statistical area, not a planning one, and it contains the whole of the Cliff Coast precinct — Austinmer, Coledale, Wombarra, Scarborough and Clifton — with Thirroul and Coalcliff sitting either side of it. That is the most scenically prized and most tightly regulated stretch of the escarpment, where the Development Opportunity Envelope controls bite hardest and where the region’s worst landslide occurred. It is also the stretch falling fastest.
That is not a coincidence, and it is the single most useful thing in this article for anyone holding escarpment property. The scenic premium is the first thing to deflate when buyer competition thins. Constrained, high-value, view-dependent stock is the most cyclical stock in the region — it outperforms hardest on the way up and gives back hardest on the way down. A valuation that leans on 2024 comparables from Austinmer or Coledale is leaning on the top of that cycle.
Cotality’s own read on the regional picture, as reported locally, is consistent: buyers have shifted toward affordability, and inland regions have broadly outperformed more expensive coastal regions such as the Illawarra.
On where it goes next, we will quote rather than predict. Cotality research director Tim Lawless has been reported as suggesting a decline of five to ten per cent, likely toward the lower end, noting that it would take a fall of about 7.6 per cent to push the region back below a million and describing a drop of that size as probably unlikely given the region’s population growth and low volume of new construction. That is his forecast as reported in mid-2026, not ours.
West Dapto: the number that decides residual land value
The region’s other structural story is West Dapto, Wollongong’s largest urban release area, underway since 2011 and planned for roughly 19,800 dwellings and 57,400 additional residents across more than 1,700 hectares over a 40 to 60 year horizon. Five stages; the first two are delivering, and most of the remainder still has to be rezoned.
The figure that matters for anyone valuing land there is not the dwelling count. It is that development contributions run to about $79,000 per dwelling under the contributions plan IPART assessed in December 2024 — a plan designed to raise in the order of $1.57 billion from developers over close to sixty years, which IPART found to be essential and reasonable infrastructure at reasonable cost.
For context on scale, West Dapto was granted greenfield status allowing a $30,000 contributions cap by ministerial direction in 2011. The rate now runs at more than two and a half times that.
A fixed charge of that size lands directly on residual land value. It is deducted before the developer’s margin, it does not move with the market, and in a region where the research house expects values to soften it absorbs headroom that price growth would otherwise provide. That is a mechanical, sourced reason to treat greenfield land here differently from established stock — which is a more useful thing to know than a growth-rate comparison. We looked for a defensible series comparing West Dapto’s capital growth with the rest of the Illawarra and could not find one; the suburb-level figures for Dapto that circulate disagree with each other by four percentage points on the same period, so we are not using them.
What we are not publishing, and why
We are not quoting a Wollongong suburb-level median, or separate house and unit figures, or rental yields.
The suburb-level medians in circulation disagree by margins no valuer could work with — across the aggregators consulted for this article, the median house figure ranged from under $800,000 to about $1.3 million, with twelve-month growth quoted anywhere from −1.5 to +6 per cent depending on source, geography and period. Part of that is definitional and part is real, but none of it was traceable to a primary release we could verify. For house-versus-unit splits and gross yields at Illawarra level, we could not find a public source at all, so we have left those out rather than estimate them.
That gap matters less than it sounds, because a single median across this region would be close to meaningless anyway. A beachfront cottage at Austinmer, a townhouse in the West Dapto release area, an escarpment block carrying a slope instability record and a Wollongong CBD apartment are four unrelated markets sharing a postcode range — and as the June figures show, they do not even move in the same direction in the same month.
What this means for a valuation here
Four questions decide most Illawarra assessments, and only one of them is about the market.
- Is there a slope instability record against the land? Not “does it look steep” — is there a record. That determines whether Chapter E12 engages, and with it the cost, the timeline and in some cases the buildability. The way to ask is the section 10.7(5) part of the planning certificate, not the part that comes with the contract.
- If there is, what is the risk classification and is there a landslide history? Moderate risk is a design problem. A landslide history without satisfactory remediation is a refusal ground.
- Is the geotechnical documentation current and does it cover this lot? Two years, and subdivision-level reports do not automatically flow down.
- Which sub-market is this actually in? Northern beaches commuter belt, CBD apartment stock, western release areas and the southern coastal towns do not move together, and the regional median describes none of them.
Methodology
- Escarpment development regime: Wollongong Development Control Plan 2009, Part B, Chapter B6 Development in the Illawarra Escarpment, in force 1 July 2023, read directly. Quotations are from its application clause, the Development Opportunity Envelope provisions, the geotechnical requirement and the building height controls. Chapter B6 defers to the Wollongong LEP 2009 maps for lot size, floor space ratio and height.
- Landslide inventory and susceptibility figures: University of Wollongong Landslide Research Team, as presented in 2009 and covering the period 1880 to 2006 across a 188 square kilometre model area. Published site counts have varied between editions of this work, so the figures are dated rather than presented as current. The susceptibility zoning is a research output, not a statutory instrument — the regulatory trigger remains the council property database record under Chapter E12.
- The August 1998 storm rainfall totals are from New South Wales SES material on that event. The 1988 Coledale embankment failure is described as disputed as to cause because the State Rail Authority’s finding has been publicly contested; the fatalities and the century-long known instability of the embankment are not in dispute.
- Disclosure at sale: a combined planning certificate issued by Wollongong City Council under sections 10.7(2) and 10.7(5) of the Environmental Planning and Assessment Act 1979 on 31 May 2024, read in full and obtained through a conveyancing search provider, together with the state planning department’s fact sheet on the proposed 2021 planning regulation, published August 2021, for the distinction between the mandatory 10.7(2) part and the optional 10.7(5) part. That fact sheet described a regulation that had not yet commenced, so confirm the distinction against the regulation now in force; the requirement to attach a certificate to a contract sits in the conveyancing rules rather than in the planning Act itself. Quotations are from those two documents. Two limits on that evidence. It is a single certificate, for an institutional lot in the city centre — the Wollongong Hospital site — where the land stability answer was negative, so we describe where the question is answered and on what terms rather than quoting the wording used for a lot that is on the layer. And a certificate speaks as at its date — the reader’s own certificate is the only one that describes their land. The same certificate is the source for Chapter E12 Geotechnical Assessment being the council’s adopted policy as at May 2024 — and, on its list of draft plans then on exhibition, for the possible renumbering flagged at the top of this article, and for its statement that the land was “not proclaimed to be a mine subsidence district within the meaning of the Coal Mine Subsidence Compensation Act 2017”.
- The regime’s origin, the status of the council’s mapping and the “tolerable”/“acceptable” history: P R Tobin, Senior Geotechnical Engineer, Wollongong City Council, “Slope Instability – Managing the Risk: A Regulator’s Perspective”, Australian Geomechanics Vol 46 No 2, June 2011, read directly. It is an authored account by the regulator rather than a council policy document, and it is fifteen years old — we have used it for the history and the stated reasons, both of which are durable, and not for anything presented as current practice. Where it describes how the information appeared on a planning certificate, it predates the renumbering of section 149 as section 10.7 and the certificate format has since changed; the 2024 certificate above governs that point, not the paper. We could not find a publicly searchable landslide hazard layer for the local government area as at the date of this article, which is not the same as establishing that none exists.
- Lending treatment: the Australian banking and finance industry’s Residential Valuation Standing Instructions for PropertyPRO, progress inspection and restricted assessment reports, read directly. The copy available to us is a comparison document, showing a revision dated 6 December 2021 against a version dated 4 October 2020, so we attribute it to the instrument rather than to an edition. The two editions are not identical on the point we quote: one gives the critical effect as a property that “shows signs of slippage and subsidence”, the other as one that “shows signs of slippage”. We quote the wording common to both, and readers should note that where the threshold sits — slippage alone, or slippage and subsidence — differs between them. Confirm the current edition with the Australian Property Institute before relying on it. The rating scale and the environmental risk matrix are from the separate document the instructions defer to: the Australian Property Institute’s PropertyPRO Supporting Memorandum, effective 10 May 2020, read directly — unlike the standing instructions, it carries a single unambiguous date. Quotations are from its risk analysis preamble and its property risk ratings matrix. Confirm the current edition with the Australian Property Institute before relying on the placement of any entry — the standing instructions require the most recent Memorandum, and a clear date of effect says nothing about whether an edition is still current. Note also that we checked, and rejected, the widely repeated claim that a rating of 4 or 5 causes a loan to be declined. What the Memorandum rebuts is the standard’s own intent — a high rating is “not necessarily intended” as a lending recommendation, and ratings are “an indicator only” — not lender behaviour, which is outside its scope and on which we make no claim either way. The observation in the closing paragraph of that section — that the council’s unpublished mapping falls outside the boundary the Memorandum draws around the risk analysis — is ours, drawn from setting the two documents side by side. Neither document says it.
- We make no claim about the effect of a slope instability designation on insurance availability or on pricing. Australian data on premiums or refusals tied to a landslip designation is not something we could source, and it is exactly the kind of assertion that should not be made without one.
- Slope instability regime: Wollongong Development Control Plan 2009, Part E, Chapter E12 Geotechnical Assessment of Slope Instability, version dated 19 July 2021, read directly. Quotations are from the chapter’s definitions section and clauses 4.1, 5.1.1, 5.1.2, 5.1.4 and 5.3. The council’s website blocks automated retrieval, so the chapter was read from an archived capture; confirm the current version with Council before relying on it for a specific application.
- We have not attempted to trace the history of any Wollongong LEP 2009 provision on slope instability; the article simply states that the operative controls sit in the DCP and suggests readers check the current LEP before relying on advice that cites it.
- Port Kembla: BlueScope’s published Illawarra employment figures and contemporaneous reporting of the No. 6 blast furnace reline approval and its $1.15 billion revised cost. The demerger of BHP’s steel business is a matter of corporate record. We describe the reline as scheduled for completion during 2026 rather than completed, because we have not confirmed the furnace has been relit. We have not treated the project as a simple industrial success story: a contractor was killed during the works in November 2025.
- Offshore wind: Department of Climate Change, Energy, the Environment and Water material on the declared Illawarra area — the 15 June 2024 declaration, the 1,022 square kilometre maximum area, the 14,211 consultation submissions, the shift a further 10 kilometres offshore to minimise visual impacts, and the published distances to coastal locations. The withdrawal of the sole applicant on 23 January 2026 is from contemporaneous reporting and a joint statement by the region’s federal members. We assert no effect on property values from the declared zone — no sourced Australian study exists and, with no proponent, the question is speculative. This is a politically contested subject and we have confined ourselves to dated facts.
- Port Kembla Energy Terminal: operator and public reporting. Start-up timing has moved repeatedly; the “no earlier than 2027” position is as at the date of this article.
- We have published nothing on contamination or remediation liability affecting specific industrial land in the region. We could not source it, and an unsourced assertion about identifiable land is not a risk worth taking.
- Market figures: Cotality (formerly CoreLogic) Home Value Index, index results as at 30 June 2026, for the national, Sydney and regional New South Wales numbers, read directly. The Illawarra median dwelling value of $1,082,674, the region’s 0.2 per cent monthly movement and the sub-market movements for June 2026 are Cotality data as reported in the Illawarra Mercury and Region Illawarra in the first days of July 2026. The Sydney-to-Illawarra gap is calculated from the two medians for the same month.
- West Dapto: IPART’s Final Report — Assessment of West Dapto Development Contributions Plan 2024 (December 2024) for the contribution rate and plan value, and Wollongong City Council for the dwelling, population, area and staging figures. IPART’s site blocked automated retrieval, so the contribution rate is stated as approximate rather than to the dollar. Note that commercially published area figures for West Dapto differ from the Council’s by a factor of nearly three; we have used the Council and IPART figures only. We make no claim that West Dapto underperforms the wider region — we could not find a defensible comparative series, and the suburb-level figures in circulation for Dapto disagree by four percentage points over the same period.
- The forecast of a five to ten per cent decline is attributed to Cotality research director Tim Lawless, made in mid-2026. It is quoted as his opinion and is not a Landmark projection.
- We have not published suburb-level medians, house-versus-unit splits or rental yields for the Illawarra. Suburb-level figures in circulation ranged from under $800,000 to about $1.3 million for the house median with growth quoted between −1.5 and +6 per cent, none traceable to a primary release; for the house/unit split and gross yields we could find no public source at Illawarra level. We would rather leave a gap than fill it with an estimate.
- Mine subsidence: the declared district list, the agency’s all-districts map and the individual Appin (PP5223) and Wilton (PP5228) district plans, published by Subsidence Advisory NSW and read directly. The absence of a declared district over the Illawarra coastal strip was checked three ways: the published list of 30 districts contains none named for a Wollongong locality; the all-districts map shows the southern district polygons lying north and west of the Wollongong LGA boundary; and on the individual plans the district boundaries fall within Campbelltown, Camden and Wollondilly. Note that the Wilton sheet also labels the adjoining Wingecarribee and Wollongong local government areas — labelling a neighbouring LGA is not the same as the district extending into it, and the Wilton boundary stops short of Wollongong. The district maps carry a 2017 copyright date; for a property-specific answer use the agency’s Spatial Viewer rather than the district maps or this article. The compensation position outside districts and the limitations of the mine workings layer are quoted from the agency’s own material.
- Dendrobium: NSW Planning Portal records for application SSD-8194, Dendrobium Mine Extension Project, determined Refused on 5 February 2021 by the Independent Planning Commission, and the separate application SSI-33143123, status Withdrawn. The two are distinct applications — the project was refused once and a later application withdrawn, not refused twice. The impact figures are those the Commission weighed in that determination.
- Mine ownership: the 2024 transfer of Illawarra Metallurgical Coal from South32 to the Golden Energy and Resources / M Resources joint venture is reported in trade press and is stated here at that level only — we have not confirmed the corporate detail to a primary source. Production, employment and reserve figures published by the operator are not reproduced here as independent data.
- We make no prediction about the outcome of any current Dendrobium extension proposal. Consent runs to 2030 and a further proposal has been in preparation; readers should check the planning portal rather than rely on a dated article.
- How mine subsidence administration works in New South Wales generally is covered in our Newcastle and Hunter guide rather than repeated here.
Frequently asked questions
How do I know if a Wollongong property has a slope instability constraint?
Order the optional part of the planning certificate. The trigger under Chapter E12 of the Wollongong DCP is whether the land is recorded as known or suspected to be subject to slope instability in Council’s property database — not whether it appears on a public zoning map or looks steep. The certificate that must be attached to the contract of sale, the section 10.7(2) part, only confirms that the council has adopted Chapter E12, which is true of every property in the local government area. The lot-specific answer sits under a LAND STABILITY heading in the section 10.7(5) part, which is optional, separately requested and separately paid for. Order it, and read that heading. Note the terms the council attaches: it does not warrant that its maps hold all information it has received about the land, it is under no obligation to supply the information, and section 10.7(6) of the Environmental Planning and Assessment Act 1979 provides that a council incurs no liability for advice given in good faith under that subsection. This is general information about how the certificate works, based on one certificate issued in 2024, and is not advice about any particular property — your own certificate is the one that describes your land.
Does a slope instability record mean I cannot build?
No. The chapter sets acceptable risk for loss of property at low or very low on the AGS 2007 risk matrix, and expressly states that a moderate risk assessment does not preclude development where appropriate measures are taken. What does prevent development is a site with a landslide history that has not been satisfactorily remediated, or a risk that cannot be brought to an acceptable level by design or practicable mitigation.
How long is a geotechnical report valid in Wollongong?
Two years. Reports older than that will not be accepted unless reviewed and re-certified on Council’s form. A geotechnical report prepared for a subdivision also does not automatically cover an individual lot within that subdivision without re-certification — so an estate-level report handed over at sale may be worth less than it appears.
Will offshore wind turbines be visible from Illawarra beaches?
There is no current proposal. The Illawarra offshore wind zone was declared in June 2024, but no feasibility licence was ever awarded and the last remaining applicant withdrew in January 2026, so the zone is declared with no active proponent. If a project were ever built, the declared area sits at least 20 kilometres offshore — the department’s published distances are around 20 to 22 kilometres from Stanwell Park, Thirroul, Bulli and Wollongong, 25 from Kiama Lighthouse and 30 from Werri Beach, the area having been moved a further 10 kilometres out expressly to reduce visual impact. We make no claim about effects on property values: no sourced Australian study exists, and without a proponent the question is speculative.
Does coal mining affect Wollongong property the way it affects Newcastle?
No, and the difference is structural. Newcastle and Lake Macquarie sit above shallow historical workings, with declared mine subsidence districts running under residential suburbs. The Illawarra’s mining is deep longwall beneath the escarpment and Sydney’s drinking water catchment, and its documented risks are to cliffs, watercourses and reservoirs rather than to houses. When the Dendrobium extension was refused in 2021, the impacts weighed included potential fracturing of up to 40 cliffs and a predicted loss of millions of litres of water a day from two dams. That is why there is no declared subsidence district over the Illawarra’s coastal suburbs — the risk is real but it is not the same risk.
Why does clearing trees on an escarpment block reduce what I can build?
Because on escarpment land the buildable envelope is defined by the screening vegetation itself. Chapter B6 of the Wollongong DCP sets the vertical limit of the Development Opportunity Envelope at “no greater than 66% of the height of the forest trees providing foreground screening” adjacent to it. The trees are not landscaping around the development right — they establish it. Removing them shrinks the envelope rather than opening the site up.
Is Wollongong in a mine subsidence district?
No. Subsidence Advisory NSW’s declared districts relevant to the southern coalfield — Appin, Wilton, Picton, South Campbelltown and Bargo — are on the plateau west and north of the escarpment, in the Campbelltown, Camden and Wollondilly council areas. The inhabited Illawarra coastal strip is not within a declared district, which is the opposite of the position in Newcastle and Lake Macquarie. Claims that significant parts of the Wollongong LGA fall within mapped districts do not match the agency’s published list and maps. For a property-specific answer, use Subsidence Advisory’s Spatial Viewer rather than a district map or a summary article. Note two things that still apply: compensation for mine subsidence damage is available outside districts provided the building work was properly approved, and the recorded location of historical workings is not straightforwardly public.
Is the Port Kembla steelworks closing?
No. It is Australia’s largest crude steel production plant, operated by BlueScope, employing around 3,000 people directly in the Illawarra, and BlueScope has approved a roughly billion-dollar reline of its No. 6 blast furnace. The widely used phrase “the former BHP steelworks” describes Newcastle’s Mayfield plant, which closed in 1999 — not Port Kembla.
What is the median property value in the Illawarra?
The Illawarra median dwelling value was $1,082,674 in June 2026 on Cotality data, and the region has been above a million since March 2025. Sydney’s median in the same month was $1,265,608, so the gap is around $183,000 — roughly 14 per cent, which is far narrower than the “affordable alternative” framing suggests.
We are not quoting suburb-level medians, house-versus-unit splits or rental yields. The suburb figures in circulation ranged from under $800,000 to about $1.3 million with growth quoted between −1.5 and +6 per cent depending on source and period, and none was traceable to a primary release. In a region where the northern coastal strip and West Wollongong moved in opposite directions in the same month, a single sub-regional median would not describe either.
Which parts of the Illawarra are falling fastest?
On June 2026 movements, the sharpest monthly fall was Thirroul to Coalcliff at −1.0 per cent, followed by Windang to Primbee at −0.7 per cent, while Helensburgh, Albion Park Rail and West Wollongong each rose 0.3 per cent. The notable point is that Thirroul to Coalcliff is the most scenically prized and most tightly regulated stretch of the escarpment. Constrained, view-dependent stock tends to be the most cyclical in the region — strongest on the way up and weakest on the way down.
Sources:
- Wollongong Development Control Plan 2009 — Chapter E12, Geotechnical Assessment of Slope Instability
- Wollongong Development Control Plan 2009 — Chapter B6, Development in the Illawarra Escarpment
- University of Wollongong — Landslide Research Team
- Wollongong City Council, combined planning certificate under sections 10.7(2) and 10.7(5) of the Environmental Planning and Assessment Act 1979, issued 31 May 2024
- NSW planning department, Proposed EP&A Regulation 2021 fact sheet, August 2021 — for which part of a certificate must be attached to a contract for sale
- P R Tobin, “Slope Instability – Managing the Risk: A Regulator’s Perspective”, Australian Geomechanics Vol 46 No 2, June 2011, published by the Australian Geomechanics Society
- Australian banking and finance industry, Residential Valuation Standing Instructions for PropertyPRO, progress inspection and restricted assessment reports — edition unstated, see Methodology
- Australian Property Institute, PropertyPRO Supporting Memorandum, effective 10 May 2020 — for the risk rating scale and the property risk ratings matrix
- Subsidence Advisory NSW — Mine subsidence districts
- NSW Planning Portal — Dendrobium Mine Extension Project (SSD-8194)
- BlueScope — Illawarra operations
- Cotality Home Value Index — index results as at 30 June 2026, for the national, Sydney and regional NSW figures
- Illawarra median, sub-market movements and the Lawless forecast: Cotality data as reported in the Illawarra Mercury (1 July 2026) and Region Illawarra (3 July 2026)
This article is general information about the Wollongong and Illawarra property market — it is not planning, legal or financial advice. Development controls, instruments and market conditions change; confirm the current position for your property with Wollongong City Council and your adviser. Last verified 31 July 2026.
See also: Property Valuation Wollongong · Property Valuation NSW · Newcastle and Hunter Property Values · Industrial Valuations · Pre-Purchase Valuations · Commercial Valuations

About the author
Tajinder Dhillon
Principal Valuer
Tajinder Dhillon is the Principal Valuer at Landmark Valuations, a RICS-regulated property valuation firm. He leads independent valuations across residential, commercial, industrial and rural property throughout Australia.
Connect on LinkedIn